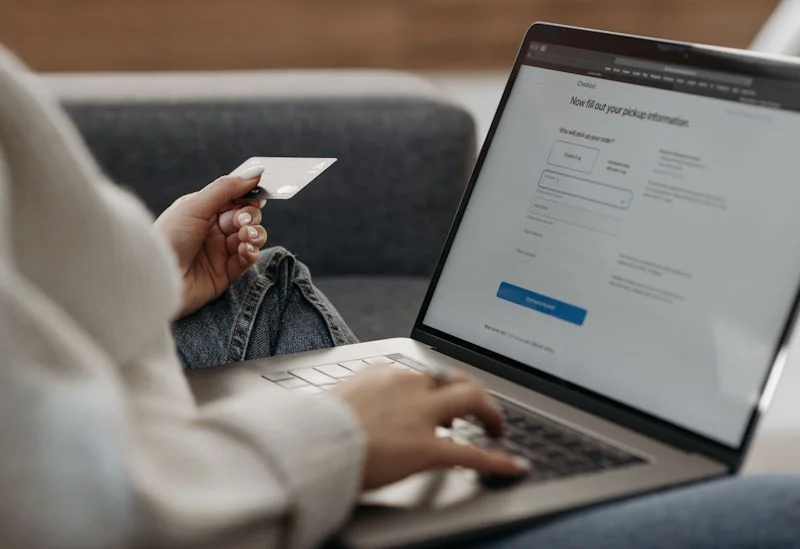
Nobody sits down and decides to spend £2,000 a year on nights out, £1,300 on coffee, or £700 on things gathering dust in a cupboard. Those totals arrive a purchase at a time, in amounts too small to register as a decision worth thinking about. A coffee on the way to work. A takeaway ordered because cooking felt like too much. A £15 top added to a basket at midnight because scrolling had already filled twenty minutes and closing the tab felt like giving up on something. None of it feels like spending in the moment it happens. It feels like just getting through the day.
That gap, between what everyday life feels like it costs and what it actually costs, is where most household budgets quietly come apart. It is not usually the big purchases that break a budget. Most people plan carefully for a holiday, a car, or a house deposit. It is the dozens of small, situational, emotionally driven purchases that never get planned at all, because each one is too small on its own to feel worth tracking, and by the time they are added together across a year, the total has usually grown far past what anyone would have guessed if you had simply asked them.
Part of the problem is genuinely psychological rather than a matter of poor discipline. Purchases made under stress, boredom, social pressure, or tiredness are processed differently by the brain than purchases made with a clear head and a shopping list. The decision to buy often happens before the rational, cost-weighing part of the brain gets a proper say, which is why a considered budget can be blown by an evening that never felt like a spending decision at all. Layer on top of that the fact that so much everyday spending is situational rather than categorical, tied to work, travel, socialising, or simply having nothing else to do, and it becomes genuinely difficult to see the shape of your own habits without something built specifically to reveal them.
That is what this collection of calculators is for. Savzz has built the UK’s largest set of behavioural spending calculators, each one isolating a specific pattern rather than asking a single vague question about how much you spend. One measures what stress spending costs. Another measures boredom. Another looks at the gap between what you spend and what you actually regret afterwards. Others deal with situational costs rather than emotional ones: the true cost of convenience, the maths behind click and collect versus delivery, what unused belongings are actually worth, and what a clothing habit costs once it is priced by the wear rather than the price tag.
This page is the hub that ties all of them together. It explains the research behind why everyday spending stays invisible, introduces each calculator and what it measures, and shows how to use several of them together to build a genuinely complete picture of where your money actually goes. None of this is about guilt. Spending isn’t irrational, it is situational, and once a pattern is visible in pounds and pence rather than a vague feeling, it stops being something that just happens to you and becomes something you can actually choose.

Why Everyday Spending Is So Hard to See
Small purchases share a set of features that make them almost invisible to normal financial awareness. Each one is below the threshold that usually triggers a second thought. A £4.50 coffee, a £6 meal deal, a £2 lottery ticket, none of these register as a decision that deserves scrutiny, because scrutinising a £4.50 purchase feels disproportionate to the amount involved. The trouble is that this logic applies to every single small purchase individually, while the total across a year is built from hundreds of them.
Research from Lloyds Bank has found that UK adults typically underestimate what they spend on food and drink away from home by 30 to 40 percent compared to what their actual transaction history shows. That is not a case of people being dishonest about their own habits. It reflects how hard it genuinely is to mentally total dozens of small purchases that never felt worth remembering individually at the time. A similar pattern shows up across other studies: a 2023 Finder survey found UK adults spend an average of £1,100 a year on impulse purchases, while Barclaycard’s transaction-based research puts a comparable figure closer to £4,680, a gap that exists mainly because self-reported estimates are built from memory rather than a bank statement.
Emotional triggers make the gap wider still. Purchases made while stressed, bored, tired, or under social pressure follow a different decision path than purchases made with a clear head. The Money and Mental Health Policy Institute found that 93 percent of people experiencing mental health difficulties had made a financial decision they later regretted, with stress the most commonly named trigger. This is not a clinical issue limited to a small group. It is a fairly universal pattern: an emotional state overrides the usual weighing up of cost against value, and the purchase that follows is driven more by the feeling than by any real want for the item itself.
Situational spending compounds this further. Spending tied to work, travel, social occasions, or simple boredom rarely gets grouped together in anyone’s mental accounting, even though it draws from the same monthly budget as rent or groceries. The coffee run belongs to “work.” The takeaway belongs to “Tuesday night.” The wedding gift belongs to “being a good friend.” Each category feels separate and reasonable on its own terms, and none of them ever gets weighed against the others across a full year, which is exactly why the combined total so often comes as a surprise.
This is the specific problem calculators are good at solving. A calculator does not rely on memory or a rough mental estimate. It takes a frequency and a typical cost per occasion and turns vague habits into a concrete annual figure, broken down by category and by trigger. Once a pattern that felt like background noise is converted into a specific pounds-and-pence number, it stops being invisible, and the decision about whether to keep spending that way, cut back, or redirect the money elsewhere finally becomes a conscious one.
The Spending & Shopping Calculators
Each calculator below is built around a single behavioural or situational pattern rather than trying to cover every type of spending at once. Some deal with the emotional drivers behind unplanned purchases: stress, boredom, social pressure, and the specific gap between spending and regret. Others deal with situational costs that are easy to underestimate simply because they are scattered across dozens of small moments: convenience purchases, delivery fees, and the value tied up in things sitting unused around the house. Together they cover most of the everyday spending that never makes it into a conventional budget.
Retail Therapy Calculator
Stress spending is one of the most common and least discussed purchasing patterns in the UK. When something has gone wrong, whether that is a difficult day at work, an argument, or a general sense of being overwhelmed, buying something offers a quick, reliable way to feel a bit better. The purchase itself does not need to be a treat in the traditional sense either. Stress shoppers reach for practical items just as often as indulgent ones, home goods, clothing, tech, anything that feels like a small act of taking control when everything else feels out of it.
What makes stress spending worth putting a number on is that it rarely announces itself as a coping mechanism. It looks, from the inside, like an ordinary purchase that happened to occur on a bad day. The Retail Therapy Calculator asks specifically about the situations that tend to trigger a stress purchase, how often they happen, and what gets bought in response, then builds an annual figure from your own patterns rather than a national average.
Use the Retail Therapy Calculator to see what your own stress-driven spending adds up to across a year.
Boredom Spending Calculator
Boredom is one of the costliest spending triggers precisely because it comes round so often. Unlike a single stressful event or a one-off social occasion, boredom is a recurring, low-level state that most people experience several times a week, and each occurrence carries its own small chance of turning into an unplanned purchase. A OnePoll survey found that 68 percent of UK adults describe themselves as impulse shoppers, with most naming boredom as the main trigger behind it.
The boredom multiplier is what sets this calculator apart from a plain spending tracker. It runs from x1.10 at mild boredom up to x1.70 at the point where shopping has effectively become a coping mechanism for having nothing else to do, and it shows how much of an annual total in susceptible categories comes from the mood itself rather than any genuine want for the items bought. For someone with a high boredom rating and several active spending categories, that boredom premium alone can easily reach £400 to £800 a year.
Late-night browsing deserves particular attention here. Tiredness lowers resistance to spending triggers, and the combination of a bored evening, a phone already in hand, and shopping apps a swipe away is one of the most reliably expensive patterns covered by any calculator on this page. Purchases made at midnight are consistently harder to explain the next morning than purchases made earlier in the day, because they were made by a tired version of the buyer with noticeably less capacity for weighing up whether something was actually needed.
Use the Boredom Spending Calculator to see your own boredom premium and where it is coming from.
Social Pressure Spending Calculator
Saying yes to a birthday dinner, a hen weekend, or a round of drinks almost always feels easier in the moment than saying no, even when the money is not really there. That asymmetry sits behind a genuinely large amount of UK household spending. Lloyds Bank found that the average UK adult spends around £2,000 a year on social occasions, nights out, meals, events, and gifts, with around 40 percent admitting they had spent more than they were comfortable with at least sometimes because they did not want to look cheap or feel left out.
Weddings and the events built around them are a particular concentration point. A 2023 Hitched survey found the average UK hen party now costs around £370 per attendee before outfit, travel, or anything spent in the run-up to the day itself, and attending a wedding as a guest, gift, outfit, travel, and accommodation included, typically runs to £350 to £600. Anyone attending several weddings and their associated hen or stag events in the same year can see this single category alone reach £1,500 to £3,000.
The calculator also covers two areas most tools miss entirely: influencer-driven purchases and spending shaped by how something will look on social media. A 2024 YouGov survey found 35 percent of UK adults aged 18 to 34 had bought something in the previous three months specifically because an influencer featured it, a pattern that sits alongside the older, more familiar version of FOMO but is amplified by how constantly social platforms surface what everyone else appears to be doing, buying, and attending.
Use the Social Pressure Spending Calculator to see the gap between the social life you would choose freely and the one shaped by what you feel you owe other people.
Impulse Spending Trigger Calculator
Most spending tools ask how much you spend. This one asks why, because the why is where the actual pattern lives. The calculator covers twelve specific triggers that between them explain most impulse spending in the UK: stress, boredom, low mood, social pressure and FOMO, sales urgency, late-night browsing, TikTok and Instagram influence, the treat yourself mindset, the payday effect, spending after an argument, tiredness, and celebration.
Buy now pay later services complicate the picture further. Research from Which? found that around one in three UK adults used a BNPL service in 2024, and the link to impulse spending is well established: when a purchase does not feel like money leaving your account immediately, the psychological cost of paying drops, which tends to increase both transaction size and the likelihood of buying something that was not originally planned.
Impulse spending happens not through weakness but because spending decisions are made in an emotional part of the brain before the rational, cost-weighing part gets involved. Research from Barclays found UK adults make around three unplanned purchases a week, adding up to roughly £1,500 to £4,680 a year depending on how impulse spending is defined and measured. Knowing your own specific triggers will not make you immune to the process, but it opens a window where a few seconds of conscious awareness between the trigger and the purchase is often enough to change what happens next.
Use the Impulse Spending Trigger Calculator to name your own triggers and see exactly where the biggest opportunity to cut back is sitting.
Impulse Buy Regret Calculator
There is a meaningful difference between impulse spending and regret spending, and most tools that measure the first never bother separating out the second. Plenty of spontaneous purchases turn out well: a book bought on a whim that becomes a favourite, a kitchen gadget used every week, a jumper still in regular rotation two years later. Reducing that kind of spending would make life marginally poorer for no real financial benefit. Then there is the purchase made tired, bored, or scrolling at midnight, that arrives at the door and produces a genuinely different feeling. Reducing that kind of spending makes life materially better without giving up anything of real value.
The regret-weighted cost this calculator produces separates those two categories rather than lumping them together into one number that tells you nothing about which purchases are actually worth cutting. A survey by TSB found UK consumers spend an average of £83 a month on impulse purchases they later regret, which scales to nearly £1,000 a year in regret spending alone, and research from Which? found that purchases made between 10pm and 2am were twice as likely to be returned as purchases made during the day.
Subscriptions deserve a specific mention here, because they are one of the most purely regret-generating categories precisely because the cost recurs monthly without anyone actively choosing to keep paying it. Research by Halifax Bank found UK adults underestimate their monthly subscription spending by an average of £32 a month, which works out to well over £350 a year in charges most people could not fully list if asked.
Use the Impulse Buy Regret Calculator to separate the spending you genuinely enjoy from the spending that is quietly making things worse.
Lottery Ticket Opportunity Cost Calculator
A couple of lottery tickets a week does not feel like a financial decision. It feels like a small ritual, a couple of pounds spent on the brief, enjoyable fantasy that Thursday’s draw could be the one. What that same money could have become if redirected into an ordinary investment instead is where the real story sits, because small regular amounts are exactly what compound interest was built to transform.
Someone spending two National Lottery tickets twice a week is looking at around £416 a year, a figure that barely registers on a monthly budget but compounds into something much larger over time. At a 7 percent annual return with monthly compounding, six pounds a week redirected into investments grows to somewhere in the region of £16,000 over 20 years and around £38,000 over 30, without requiring a single increase in contribution after the initial decision to redirect the money.
The UK National Lottery’s odds of winning the jackpot sit at roughly 1 in 45 million, and the odds of winning anything at all, including the smallest prize, are roughly 1 in 9.3. None of this is an argument that lottery tickets are wrong. The entertainment value and the weekly ritual are real for a lot of people, and if that is genuinely what the money buys, the calculator is simply useful context. For anyone whose ticket habit has become an unexamined default rather than a conscious choice, seeing the other side of the decision tends to be the thing that prompts a rethink.
Use the Lottery Ticket Opportunity Cost Calculator to see what your own habit could become across 5, 10, 20, and 30 year horizons.
Treat Yourself Spending Calculator
“I deserve this” is one of the most quietly powerful phrases in everyday spending, because it hands the buyer a kind of moral permission that skips straight past the usual question of whether something is needed or affordable. Treating yourself is not a problem in itself. It becomes one when it turns from an occasional pleasure into a standing justification that gets reached for after every hard day, every small achievement, and every finished task, until a genuine reward has quietly become a habit running almost entirely on autopilot.
The pattern tends to escalate without anyone noticing, because each individual treat still feels proportionate to whatever prompted it. A coffee after a stressful meeting is one thing. A coffee, a new top, and a takeaway after every stressful meeting is a materially different annual total, even though each individual purchase felt exactly as reasonable in the moment as the one before it.
The Treat Yourself Spending Calculator asks how often this mindset shows up across different categories and what tends to get bought as a result, then reveals how much of an annual spend is really functioning as a reward system rather than considered purchasing. For a lot of people, seeing that figure laid out is the first time the pattern becomes visible at all.
Use the Treat Yourself Spending Calculator to see how much of your spending is really a reward system in disguise.
Convenience Spending Calculator
Nobody decides to spend £9 on an airport sandwich. It happens the same way a £4.50 coffee happened on the way into work, and a £6 meal deal happened at lunch, and a takeaway happened because it was 8pm and nobody had the energy to cook. Each purchase is small, situational, and easy enough to justify on its own that it never gets weighed against the twenty or thirty others just like it that happen across a year.
The numbers add up fast once they are actually tracked. A daily coffee shop cup at £4.50, bought five days a week across a 48-week working year, comes to £1,080 annually, against roughly £65 to £100 for the same volume made at home. A meal deal at £5.50 a day across the same working year reaches £1,320, against £650 to £1,000 for a packed lunch made from a normal weekly shop. Days out add a category most people never think to count at all: a family spending £15 to £25 on snacks and drinks across twenty outings a year adds £300 to £500 to the total, largely unnoticed because each individual stop felt like a natural part of the day rather than a spending decision.
Lloyds Bank research found UK adults underestimate spending on food and drink away from home by 30 to 40 percent, and the gap tends to widen further once travel is involved. The RAC Foundation found motorway service prices run 60 to 75 percent above equivalent high street prices, and Which? found UK airport food and drink sits around 80 percent above high street pricing once past security. None of this is an argument against convenience itself, since time genuinely has value and paying more for it is sometimes exactly the right call. It is an argument for knowing what that trade is actually costing across a full year rather than absorbing it one small purchase at a time.
Use the Convenience Spending Calculator to see your own total across home, work, days out, travel, and social spending in one place.
Click and Collect vs Delivery Calculator
Everyone knows delivery costs more than collecting a shop yourself. What is far less clear is how much more, once every fee is properly added up, and whether the gap is worth what it costs in time. Food delivery apps in particular stack charges in a way that is easy to underestimate: a delivery fee, a service fee of 10 to 20 percent of the order value, a small order fee if the basket misses a minimum threshold, and an optional tip can push a basic order’s added costs well past £5 before a single adjustment is made for how long the whole thing takes.
Click and collect is not free either, it is simply paid for differently, through fuel, wear and tear, parking, and the time spent driving and queuing. For a typical UK car, fuel alone runs to roughly 12 to 18p per mile, with wear and tear adding another 3 to 5p on top, so even a short round trip carries a genuine cost once it happens weekly rather than once.
What makes this calculator different is the crossover hourly rate: the specific point at which your own time value makes delivery the financially rational choice rather than just the more convenient one. If delivery costs £3 more but saves 30 minutes, it breaks even at an hourly rate of £6. If it costs £5 more but only saves 20 minutes, the break-even climbs to £15. For most grocery comparisons the crossover sits somewhere between £8 and £20 an hour, which means delivery makes sense for some people and genuinely does not for others, and the only way to know which side you land on is to run your own numbers.
Use the Click and Collect vs Delivery Calculator to find your own crossover rate for grocery shops, food delivery, and retail orders.
Cost Per Use Calculator
A £900 sofa and a £40 dress look, on the price tag alone, like the dress is the safer decision. That is the trap. Price tells you almost nothing about whether something is genuinely good value, because it never accounts for how often the thing actually earns its place in your life. Sit on that sofa every evening for ten years and it costs less than 25p a use. Wear the dress once to a wedding and it costs £40 a use. The number on the price tag was never the real cost, it was only ever the deposit.
Cost per use divides the price by how many times something actually gets used, and the results routinely flip the intuitive comparison on its head. A £1,200 mattress used every night for eight years works out to £0.41 a night, exceptional value for something that occupies a third of a life. An £80 pair of trainers worn daily for two years comes to £0.11 a use, one of the best-value everyday purchases available at any price point. Meanwhile, a £300 exercise bike used twice a week for six months before becoming a clothes rail costs £6.25 per use, the exact same item that would have cost 48p per use had it stayed in regular rotation for three years. The item never changed. Only the usage did.
The calculator flags anything above £5 per use as worth a second look, which tends to happen when usage gets overestimated, when a trend piece gets replaced within a year, or when a cheap version breaks early and needs replacing sooner than planned.
Use the Cost Per Use Calculator before your next big purchase to see whether the price tag is telling you the truth.
Home Clutter Cost Calculator
Open a random drawer and there is a fair chance something in it is worth actual money. An old phone still holding a charge. A coffee machine used twice and then quietly retired to the back of a cupboard. A jumper with the tag still attached. None of it feels like money while it sits there. It just feels like stuff, right up until it gets added up.
Research by eBay UK found the average UK household holds around £700 worth of unused items at any given time, and a 2022 Barclaycard survey put the collective UK figure at around £48 billion held across every home in the country. A separate Vinted survey found the average wardrobe alone contains £100 to £150 of clothing that no longer gets worn. Households with children tend to sit on more than average, since children grow out of things fast, and anyone who has upgraded a phone or laptop in the last few years and kept the old one is almost certainly holding more value than they realise.
What sets this calculator apart from a flat national average is that it builds a picture room by room and category by category, using realistic UK secondhand values from platforms like eBay, Vinted, and Facebook Marketplace, then adjusts the final estimate based on how you actually sell rather than assuming everything gets listed by tomorrow morning. HMRC’s trading allowance also means the first £1,000 earned each year from selling personal possessions does not need to be declared, which covers the vast majority of household clear-outs entirely.
Use the Home Clutter Cost Calculator to see what is realistically sitting unused in your own home.
Fast Fashion True Cost Calculator
A £12 top and a £60 top do not actually cost what their price tags say. One gets worn five times before it goes to the back of the wardrobe and then a bin bag. The other gets worn fifty times and stays in rotation. Priced by the wear rather than the tag, the cheap top is the expensive one, and that single reframe is the whole idea behind cost per wear.
A 2023 survey by the British Fashion Council found the average UK adult spends around £1,042 a year on clothing. Six items a month at £18 each comes to £1,296 a year, and if each item gets worn around seven times before being discarded, that works out to a cost per wear of £2.57 and roughly 72 discarded items a year. Switch to two quality items a month at £45 each, worn forty times before discarding, and the annual spend actually drops to £1,080, cost per wear falls to £1.13, and the number of discarded items drops to 24 a year.
The environmental case lines up with the financial one rather than competing against it. Producing a single fast fashion garment generates around 33 kg of CO2 equivalent once raw material extraction, manufacturing, dyeing, and transport are all accounted for. A secondhand item generates around 4 kg, an 88 percent cut, because that production cost has already been absorbed by its first owner. The UK sends around 300,000 tonnes of clothing to landfill every year, much of it fast fashion bought, worn a handful of times, and replaced by whatever trend came next.
Use the Fast Fashion True Cost Calculator to compare your current clothing habit against a smarter one, side by side, in pounds and in carbon.
What These Calculators Reveal About UK Spending
Taken together, these twelve calculators tell a fairly consistent story about where UK household money actually goes, and it rarely matches the story people would tell about their own spending if asked directly.
Emotional spending patterns run through several categories rather than sitting neatly in one place. Stress, boredom, low mood, and social pressure all drive purchases that get filed under ordinary categories, clothing, food, gadgets, gifts, when the real driver was a feeling rather than a genuine need. That matters because the fix for emotionally driven spending is different from the fix for planned spending. Cutting a category outright rarely works if the underlying trigger is still there looking for somewhere else to land.
Situational spending is just as large but far easier to overlook, because it is scattered across dozens of small, reasonable-looking decisions rather than concentrated in a single recognisable habit. Convenience purchases, delivery fees, and the corner shop premium all fall into this bucket, each one small enough to seem beneath scrutiny and collectively large enough to be one of the biggest discretionary categories in a typical household budget.
The hidden annual totals that these calculators surface tend to be genuinely larger than people expect going in, and the gap between estimate and reality is remarkably consistent across the research: Lloyds Bank found a 30 to 40 percent underestimate on food and drink away from home, eBay UK found most households sit on £700 of unused value they had never priced up, and multiple studies on impulse spending show the same self-reported figures running well below what transaction data actually shows.
The reason people underestimate is not dishonesty. It is that the human brain is genuinely poor at mentally totalling dozens of small, separately justified purchases spread across a year. A calculator does the one thing memory cannot: it takes a frequency and a typical cost, multiplies it out with complete consistency, and produces a number that reflects the actual pattern rather than a rounded-down guess. That is the entire value of converting behaviour into arithmetic. It removes the guesswork and replaces it with something specific enough to actually act on.
How to Use These Calculators Together
Each calculator works well on its own, but the real value tends to come from using several of them together, because most people’s spending is shaped by more than one pattern at once.
Start with the impulse calculators to identify your triggers. The Impulse Spending Trigger Calculator and the Impulse Buy Regret Calculator both work from the same underlying idea, that knowing why a purchase happened matters more than knowing what it cost, and running both gives you a picture of which specific states, stress, boredom, tiredness, social media scrolling, are actually driving your unplanned spending, plus which of those purchases you genuinely regret afterwards versus which ones you would happily make again.
Once your triggers are visible, use the Convenience Spending Calculator to quantify the situational habits sitting underneath them, the coffee runs, the meal deals, the takeaways ordered out of tiredness rather than hunger. This is usually where the biggest single annual number in the whole exercise turns up, simply because it is built from so many small, frequent purchases.
For anything you are actually considering buying, run it through the Cost Per Use Calculator before committing. This turns the purchase decision itself into a considered one rather than an impulse, and it is particularly useful for anyone who has just identified, through the trigger calculators, that they tend to buy things they do not end up using much.
The Home Clutter Cost Calculator works in the opposite direction, helping recover value from purchases already made rather than preventing new ones. It pairs naturally with the Fast Fashion True Cost Calculator, since a large share of what typically shows up as household clutter is clothing bought under exactly the triggers the earlier calculators are designed to surface.
Use the Click and Collect vs Delivery Calculator to optimise the logistics side of spending specifically, working out where your own time is genuinely worth paying a premium for and where a short trip actually saves money once fuel and fees are properly compared.
Finally, the Lottery Ticket Opportunity Cost Calculator is worth running once as a long-term check, not because a weekly ticket habit is a problem in itself, but because it models what small, regular, easily overlooked spending becomes over a genuinely long horizon, which is a useful frame for thinking about any of the smaller recurring categories covered elsewhere on this page.
Frequently Asked Questions
Why do people underestimate their own spending so consistently?
Small purchases are individually below the threshold that normally triggers financial scrutiny, and the human memory is genuinely poor at totalling dozens of separately justified purchases spread across a year. Lloyds Bank found UK adults underestimate food and drink spending away from home by 30 to 40 percent, a gap that reflects how spending is remembered rather than any deliberate dishonesty.
Why do emotional triggers matter more than the total amount spent?
Because the fix differs depending on the driver. Purchases made from boredom respond well to genuine stimulation as a substitute. Purchases made from stress respond better to emotional awareness and other sources of comfort. A blanket instruction to “spend less” ignores the fact that different triggers need different responses, which is why calculators that separate spending by trigger tend to be more useful than a single spending total.
Why do the calculators use annual totals rather than weekly or monthly figures?
A single coffee or a single lottery ticket looks trivial on its own. The annual figure is what actually shows up in a household’s overall financial picture, and it is the only timeframe long enough to reveal the true scale of a habit that repeats several times a week without ever feeling like a single large decision.
Why is cost per use more accurate than the price on the tag?
Price only tells you what something costs to acquire. It says nothing about how much value gets returned from it. A £900 sofa used daily for a decade and a £40 dress worn once represent completely different value once divided by actual use, even though the price tags suggest the opposite ranking.
Why is convenience spending so invisible compared to other categories?
Because it is scattered rather than concentrated. A coffee, a meal deal, a service station stop, and an airport breakfast all look like separate, reasonable, one-off decisions on a bank statement, and none of them ever gets weighed against the others across a full year unless something specifically pulls them together into one total.
Why is social pressure spending so high in the UK?
Because saying no to an event, a gift, or a round of drinks carries a social cost that most people would rather avoid than the financial cost of saying yes. Lloyds Bank found the average UK adult spends around £2,000 a year on social occasions, and around 40 percent admit to spending more than they were comfortable with specifically to avoid looking cheap or missing out.
Why is boredom spending so predictable?
Because boredom is a recurring state rather than a one-off event, and shopping apps are specifically designed to be available in exactly the low-stimulation moments boredom creates. The boredom multiplier reflects this: at high boredom levels, close to half of spending in susceptible categories traces back to the mood itself rather than any real want for the items bought.
Why does impulse buy regret matter more than total impulse spending?
Because not all impulse spending is the same. Plenty of spontaneous purchases turn out well and reducing them would make life marginally poorer for no real gain. Purchases made in a specific state, tired, bored, scrolling at midnight, are the ones that consistently get regretted, and separating the two categories shows you where cutting back genuinely helps rather than applying a blanket restriction to everything.
Why does clutter have real financial value?
Because unused items retain resale value on secondhand platforms even after they have stopped being used. Research by eBay UK found the average UK household holds around £700 of unused items at any time, value that stays completely inert until someone actually lists it for sale.
Why does compounding change how lottery spending should be thought about?
Because the same weekly amount grows very differently depending on where it goes. Spent on tickets, it produces a small, recurring chance of a very large but statistically unlikely win. Invested instead, it compounds steadily and predictably, with six pounds a week reaching somewhere in the region of £16,000 over 20 years at a 7 percent return. Neither path is wrong, but only one of them is visible without a calculator.
Why do delivery fees stack up so quickly?
Because they are charged separately rather than as one combined figure. A delivery fee, a service fee of 10 to 20 percent, a small order fee below a minimum threshold, and an optional tip can each look minor on their own line but add up to well over £5 in extra costs before anything has actually arrived.
Why does fast fashion feel cheap but isn’t?
Because the price tag only reflects the cost of acquiring the item, not the cost of using it. A £12 top worn five times costs £2.40 per wear, while a £60 top worn fifty times costs £1.20 per wear. The cheaper item is, in real use terms, twice as expensive, and that gap only becomes visible once cost per wear replaces price as the measure that matters.
Explore All Spending & Shopping Calculators
- Retail Therapy Calculator
- Boredom Spending Calculator
- Social Pressure Spending Calculator
- Impulse Spending Trigger Calculator
- Impulse Buy Regret Calculator
- Lottery Ticket Opportunity Cost Calculator
- Treat Yourself Spending Calculator
- Convenience Spending Calculator
- Click and Collect vs Delivery Calculator
- Cost Per Use Calculator
- Home Clutter Cost Calculator
- Fast Fashion True Cost Calculator
Final Thoughts
None of this is a case against spending money on coffee, nights out, new clothes, or a lottery ticket now and then. Spending isn’t irrational. It is situational, shaped by mood, environment, habit, and the people around you, and most of it makes complete sense once you understand what was actually driving it at the time.
What these calculators do is make the invisible parts of that spending visible. A coffee run, a boredom scroll, a wedding season, a drawer full of things that never quite got used, none of these register as a decision on their own, which is exactly why they never get weighed against everything else competing for the same money. Once the annual figure is sitting in front of you rather than scattered across fifty small transactions, the decision stops being automatic and becomes something you actually get to choose.
That is the whole purpose behind this set of tools. Not to create guilt about a takeaway or a new pair of trainers, and not to judge any particular way of spending money. Just to give an honest, data-driven answer to the question that sits underneath all of it: what is this actually costing me across a year, and is that what I would choose if I could see the whole picture clearly? Once the number is visible, the rest is up to you.